Craig School of Business
Fresno County’s Rental Vulnerability Index
Amber Crowell, Ph.D.
Department of Sociology, Fresno State
Andres Jauregui, Ph.D.
Gazarian Real Estate Center, Fresno State
Nearly half of households in Fresno County are renters with an estimated median household income of $32,240. According to the California Housing Partnership, a family would need to make $20/hr to be able to afford the median rent in Fresno County while the state minimum wage is only $12/hr, highlighting the unaffordability of rental housing in Fresno County that mirrors the housing crisis across the nation. Based on Fresno County Superior Court records, thousands of renters are evicted from their homes every year in Fresno and the vast majority of these cases are due to unpaid rent. Significantly, the eviction rate is higher in Fresno County than in either Los Angeles County or San Francisco County, both areas that are notorious for extremely high housing costs. The typical renter household in Fresno County is rent-burdened, which is defined by the Department of Housing and Urban Development (HUD) as a household that spends 30 percent or more of its income on housing costs. This measure demonstrates the financial precarity of renters in Fresno County, placing them in a vulnerable position should something go wrong - a layoff, an illness, or an unforeseen medical bill.
As the COVID-19 pandemic drives tens of millions of adults into unemployment, we have reason to be concerned about the vulnerability of those households who rent their homes and are now losing income or falling ill to the virus. We examine the rental vulnerability of neighborhoods in Fresno County to identify areas where we would expect more households to be in danger of falling behind in rent and potentially being displaced from their homes based on factors that contribute to housing insecurity for renters. Importantly, Fresno County is both racially and economically segregated, with low-income communities and communities of color concentrated in South and West Fresno, while white and affluent communities are predominately located in North Fresno and Clovis. We expect to find higher rental vulnerability in South and West Fresno where racial and economic disparities lay the heaviest burdens.
Data
Data for this analysis is drawn from 2018 American Community Survey 5-year estimates, Fresno County Superior Court eviction filing records, and the US Department of Housing and Urban Development housing voucher program data.
Rental Vulnerability Index Construction
We construct a Rental Vulnerability Index (RVI) at the census tract level modeled after the method implemented by researchers at the City Futures Research Centre, University of New South Wales Australia. The RVI is constructed using principal components analysis (PCA), which produces a set of uncorrelated components based on a large set of correlated indicators. This is a robust method for identifying and combining correlated factors that contribute to overall rental vulnerability. Similar to the approach taken by others, we ran iterations of the PCA and dropped any indicators that did not load strongly (with at least a coefficient of 0.30) on the first component. The first component is used as the Rental Vulnerability Index. The indicators included in the construction of the index are:
- Percent of non-white householders
- Percent of single mother householders
- Percent of householders with less than a high school diploma or equivalent
- Percent of renters spending more than 50 percent of their household income on housing costs
- Percent unemployed
- Percent of housing voucher (i.e. Section 8) recipients
- Number of tenant eviction filings from years 2015 to 2019
Findings
Table 1 breaks down the components of the RVI into ranges of low to high rental vulnerability categorized by quintiles. It is not surprising to find that Census Tracts with higher percentages of non-white population, single mothers, less educated and unemployed persons, as well as the highest percentage of renters spending more than 50% of their income or more on rent have the highest rental vulnerability. Similar results were found in a recent study done by the UCLA Center for Neighborhood Knowledge (2020), although their methodology was completely different to ours. Nearly two-fifths of renter households with the highest RVI are spending more than 50% of their income on housing costs, which is over twice as high as the percentage of severely rent-burdened households in census tracts with the lowest RVI. Another striking indicator shows that the average number of evictions in the Census Tracts with the highest rental vulnerability is approximately 10 times higher than in Census Tracts with the lowest vulnerability. According to a local report on evictions in Fresno, the majority of eviction filings are due to unpaid rent and/or fees.
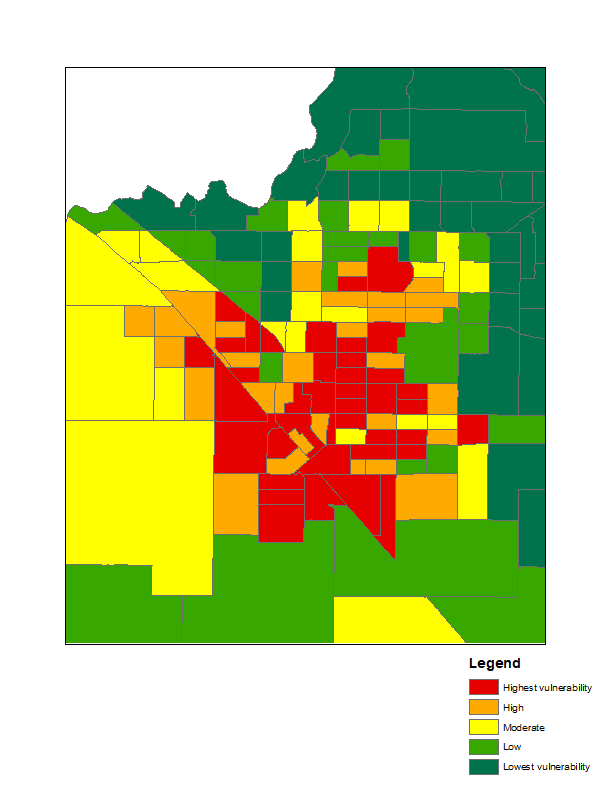
Figure 1 reveals the prominent role of segregation in producing and reinforcing disparities in rental vulnerability. The highest levels of rental vulnerability are not randomly distributed throughout the Fresno metropolitan area, but rather are concentrated in South Fresno and map onto patterns of racial and economic segregation. It is well-documented that South Fresno has historically experienced marginalization and disinvestment, including at critical points of federal financial relief following major economic crises, such as during the New Deal era. Neighborhoods in South Fresno where people of color resided were “redlined” and excluded from New Deal-era public investment in housing that elevated many families to middle-class stability. This point is relevant for considering the impact of the current economic crisis brought on by the COVID-19 pandemic. Neighborhoods in South Fresno are at risk of bearing the brunt of an impending housing crisis brought on by the economic devastation of the COVID-19 pandemic, and it will start with renters being evicted from their homes as landlords attempt to recoup their financial losses.
Conclusions
Importantly, neighborhoods with the highest levels of rental vulnerability experience compounded social and economic challenges so that solutions for reducing rental vulnerability must be comprehensive. Disadvantages faced by certain populations such as people of color, single mothers, and people with disabilities are reflected in their neighborhood-level correlations with economic factors such as poverty, unemployment, and rent-burden. Many of these factors contribute to one another, such as high levels of poverty and unemployment resulting in severe rent-burden and risk of eviction due to unpaid rent.
To mitigate the impact of skyrocketing unemployment brought on by COVID-19 shutdowns, Governor Newsom issued an executive order on March 27 declaring that residents would not be evicted due to COVID-19-related nonpayment of rent, followed by a ruling by the Judicial Council of California on April 6 that halted almost all eviction proceedings for the duration of the state of emergency in California. Additionally, residents in federally subsidized housing are protected from eviction by a moratorium put in place by the CARES Act. At the local level, both the City of Fresno and the City of Clovis have put in place housing assistance grant programs to help renters and homeowners cover housing costs. However, all of these protections are temporary and in some cases, the most vulnerable renters are still being evicted illegally during the pandemic. Our rental vulnerability index shows where housing insecurity is likely being exacerbated by the COVID-19 pandemic in the Fresno metropolitan area. We conclude with the recommendation that policies responding to the social impact of COVID-19 bear in mind the unequal impact felt by areas of Fresno where rental vulnerability is highest, particularly in South and West Fresno.
Table 1. Renters Vulnerability Index Components
| Characteristic | Lowest Vulnerability | Low | Moderate | High | Highest Vulnerability |
|---|---|---|---|---|---|
|
Percent non-white |
38.79 |
59.02 |
76.83 |
81.80 |
88.47 |
|
Percent single mother household |
5.77 |
10.68 |
13.28 |
19.35 |
24.91 |
|
Percent Less than High School Diploma |
6.40 |
16.64 |
30.69 |
32.93 |
41.14 |
|
Percent in COVID19-vulnerable occupation |
17.20 |
19.28 |
16.02 |
19.27 |
19.67 |
|
Percent of renters age 15-24 |
0.76 |
2.57 |
2.97 |
6.53 |
5.81 |
|
Percent of renters age 65 and over |
3.65 |
7.80 |
6.61 |
6.51 |
7.26 |
|
Percent of housing units that are mobile homes or RVs, vans, etc. |
3.93 |
4.30 |
5.95 |
2.75 |
1.99 |
|
Percent of renters spending 50% of income or more on gross rent |
16.69 |
21.76 |
25.00 |
32.21 |
39.97 |
|
Percent with disability |
11.15 |
13.61 |
13.20 |
14.34 |
15.44 |
|
Percent of civilian labor force unemployed |
5.16 |
7.47 |
9.66 |
11.51 |
14.62 |
|
Percent of households with housing voucher (10 or more) |
0.00 |
2.91 |
5.05 |
10.54 |
18.91 |
|
Pollution burden |
45.18 |
50.79 |
52.10 |
53.85 |
55.92 |
|
Number of evictions 2015-2019 |
15.41 |
35.30 |
53.10 |
100.78 |
156.92 |
|
Number of Census Tracts |
39.00 |
40.00 |
40.00 |
40.00 |
39.00 |
Figure 1. Rental vulnerability by census tract, City of Fresno and Clovis and surrounding areas